A website is the first impression that your potential customers get about your business. If they are not impressed, then they won't trust you and your products. A good website can help people find out what you offer, how you can help them, and if you are trustworthy or not. So, we should always make sure our websites look professional and attractive.
A good rule of thumb is that if someone is looking at your website then they are interested in what you have to offer. This means that they are probably going to click on something on your site and hopefully purchase something. If they don't buy anything, then chances are they weren't really interested in what you had to offer. Google Analytics and many other tools help in analyzing the traffic source through various reports to enable you to make impactful decisions. In this article we will look into the following:

Website Traffic refers to the number of users visiting a website. It can be measured as sessions or visits and is ideal to gauge the effectiveness of the business in terms of attracting an audience. Visitors use a variety of sources to arrive at your websites such as social media platforms, ad campaigns, and search engines. This number can vary greatly depending on how many visitors are coming to your site from search engines like Google, Bing, Yahoo, etc.
Traffic refers to the number of visitors that your website receives per day. In order to increase this figure, you need to make sure that your site is easy to navigate and has high-quality content. This means that the more people who visit your site, the better.
You need to notice your website traffic as a marketing strategy. Website traffic is of utmost importance as:
In the initial days of E-Commerce, the web traffic was considered the only way to gauge the popularity of your website as other metrics were still not found. Now with the introduction of a vast array of metrics, we can comprehensively analyze the website's traffic.
Although the number of visitors to your website is of key importance. The business owners are also interested in the following metrics:
A lot of factors contribute to the website traffic, that is why the parameter of measuring traffic alone is not enough. Analyzing other metrics gives a deeper understanding of the website's performance and success.
There are several different sources of web traffic. Some of these include direct visits, referrals, organic searches, paid advertising, social media, email marketing, display ads, mobile apps, and other channels.
This type of traffic comes from search engines like Google, Bing, etc. These are organic searches that people actually do on your website. If you want to know where people find your site, this is the best place to look.
This type of web traffic comes from websites that link directly to yours. People can visit these sites by typing in your URL into their browser.
This type of online traffic comes from other websites that refer people to yours. When someone visits a website, they often see products and services offered by companies whose ads appear on that page. Those companies pay the owner of the referring website to include their ad. In return, the company assumes that customers who click on their ad will purchase something. Some common examples of referral traffic include Facebook Ads, AdWords, LinkedIn Ads, etc.
This type of internet traffic comes from social media platforms like Twitter, Instagram, Pinterest, etc. They are free, but they only work if you have a strong following of people who trust you. Identifying which social media platforms send you the most traffic can help provide exceptional insights into where your business should focus its efforts.
This type of traffic is generated by display advertising networks like Google AdSense, Chitika, etc. You sign up for an account with them, then they show advertisements on other websites around the web.
This type of marketing uses email newsletters to promote products and services. This type of traffic is great because you get to target specific lists of people who are interested in what you have to offer.
Campaign Traffic is the number of people that visit your website from different sources like social media, search engines, email, etc. This metric gives us a good idea about how many people are finding our content through various channels. Total Campaign Traffic refers to The total number of visits that came from all campaigns.
Search Engine Traffic (SEO) is a term used to describe how many people are searching your website from Google, Yahoo, Bing, etc. SEO can be done through various methods including but not limited to link building, content creation, social media marketing, etc. There are two types of search engine traffic organic and paid.
Organic search engine traffic refers to visitors who arrive at your website without using any type of paid advertising. Paid search engine traffic refers to those who use paid advertisements to get to your website. You need both kinds of traffic to make money online. When it comes to SEO, you want to rank high in the search engines. Your goal should be to the rank the first page for popular keywords. The higher you rank, the more traffic you'll receive.
There are two ways to track traffic, which are:
A tracking pixel is similar to a cookie. It is also called a marketing pixel and is used to track web traffic, user behavior, and conversion rates. When executed properly, these tiny codes can optimize your website as well as your digital ads campaign. They help create an audience base and increase conversion rates.
Tracking pixels are used by Google Analytics to collect data from the websites. These then generate information about the number of visitors to your website. There are three other types of pixels, such as:

This pixel is also known as the Facebook Pixel. It tracks users through cookies generated by a code put on your website. This pixel is a unique code that helps websites to
This pixel is the favorite of digital marketers as it tracks consumer behavior. Since it focuses on re-visits it does not focus on high-volume campaigns. However, they can produce relevant content to enhance user experience as well as encourage re-visits.
These pixels get activated once an actual purchase has been made. These pixels need to be placed within the code of the order confirmation page. These are helpful in collecting data of sales through an ad campaign.
Google Analytics is a free and very powerful tool to track web traffic. It’s very important that you get to know the basic functions of Google Analytics as quickly as possible so you can track your web traffic data and make decisions based on the data.
Google Analytics is the most popular web traffic tracking software. It’s used by over 100 million websites. Google Analytics can track and record a huge amount of information about your users, including where they come from, what pages they visit, what devices they use to access your site, how long they stay on your site, and much more.
Google Analytics is a free service provided by Google that tracks and reports website traffic. It uses a variety of methods to determine who has visited your site. Some include IP address, referrer, location, search terms, and device type.
Google Analytics generates a huge variety of reports. Although useful for business owners these can be overwhelming to understand and interpret. Some need Google Analytics IQ Exam to be able to become an expert. This article will try to ease the process of understanding the reports for analyzing website traffic.
Google Analytics shows you how traffic arrived at a website through All Traffic Report. This is one of the most important reports in Google Analytics. This reveals the interests of your readers and indicates how they reached your blog. It can be through organic search on a different website or through ads.
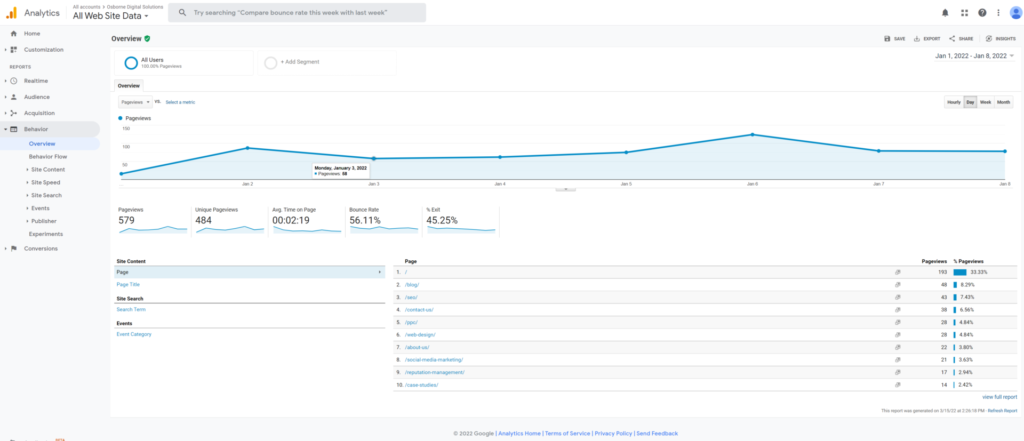
The traffic report is also called Pages Report in Google Analytics. This gives information about the pages getting the most traffic on the website. It also shows the bounce rate and time-on-site metrics.
Google Analytics has seven types of reports divided into three broader categories as Audience, Acquisition, and Behavior. The All Traffic report comes under the Acquisition section.
You should look for data for a considerable period of time like six months or a quarter. Four kinds of reports discussed above come under the All Traffic Report section such as:
The All Traffic Report provides additional features like:
The landing pages report indicates the pages of the website where visitors first arrive. To access the report you will follow the path such as:
Behavior >Site Content >Landing Pages
This report gives you an overview of the most sought-after pages of your website and segregates the data into a number of visitors and the time period like a day, week, or month. It is also useful as it shows the following:
This report shows the top three referrers that brought people to your site. These referrers may include search engines, social media sites, blogs, email newsletters, or other websites. If you want to learn more about these sources, click on the link below each referrer's name.
You can also choose to look at your overall referral traffic by clicking on the Referrals tab. This section displays the number of visits from each of your referring domains. Clicking on any domain name opens a page showing detailed information about that visitor.
According to Google Analytics IQ, this report indicates users who visited your website during a period of time such as daily, weekly, biweekly, or monthly. It helps to analyze the retention rate of the website or mobile app.
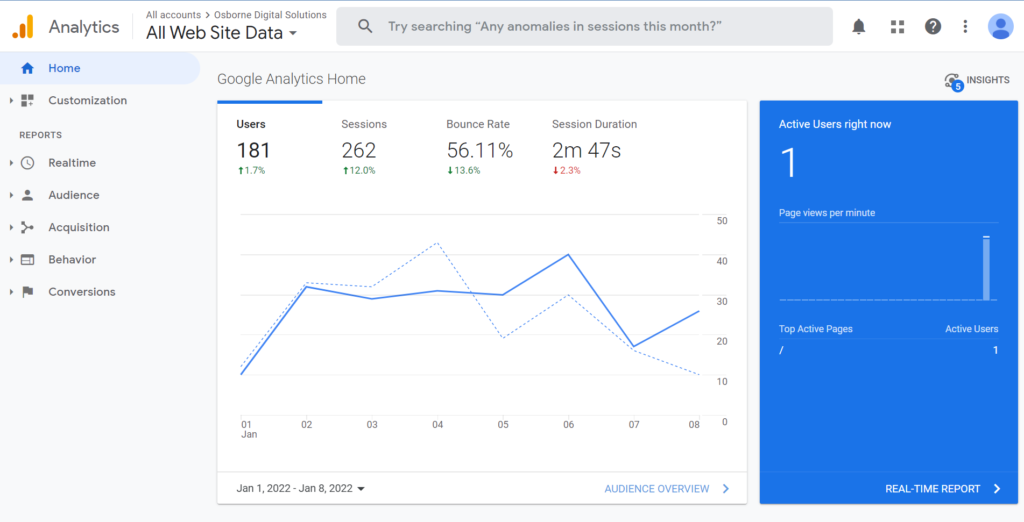
A real-time report in Google Analytics allows monitoring activities happening in real-time on your website. Each hit is recorded in seconds just as it occurs.
A custom report is a report that you can create by selecting dimensions and metrics as well as the display pattern. You need to select at least one dimension such as city or browser and one metric like Sessions, Page Views, or Bounce Rate). To create and manage custom reports you need to take the following steps:
There are different types of reports under the New Custom Report, such as:
Once you have chosen the report type you will select the dimension and metric and even choose the display location. You can also add a filter to get the information you want to see.
Google Analytics also offers Custom Dimension and Custom Metrics to gather specific data that Analytics does not catch automatically on its own. These are just like the default dimensions and metrics present in Google Analytics, except the fact that you create the custom dimension and custom metrics on your own.
Custom dimensions can be primary dimensions in the custom report. While in standard reports they can be used as secondary dimensions or Segments. To view accurate data in the custom report pair metrics and dimensions of different scopes should be used.
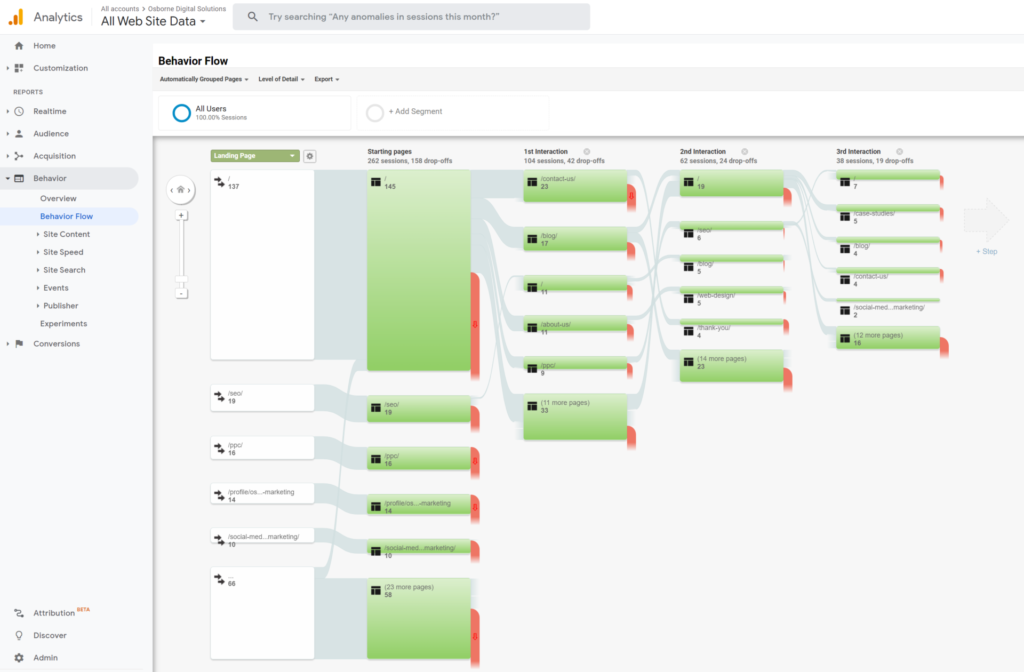
This report shows the path the visitors took through the funnel to reach Goal Conversion. It answers questions like:
There are three types of Behavior Reports such as:
The Frequency part of the report keeps a count of the number of sessions with reference to the frequency. The recency calculates the day since the last session. Based on the frequency and recency new segments can be created. Google Analytics has segments, which are audience groups that enable you to see how different customers interact on your website. The segments help improve your lead generation funnel.
The Engagement Report in Google Analytics helps you to see the pages and screens with maximum user engagement. It also allows you to better understand user behavior through events.
There are usually two types of visitors one which is visiting your web page for the first time and the other who have come back to your website. Google Analytics uses the difference to understand the visitors of your website.
In Google Analytics the Ecommerce transactions and conversions are credited to ads, campaigns, and searches that lead the user to convert. The multi-channel funnel report answers questions like:
This report helps analyze the conversion path through the time lag report and channel interactions. The channel labels in the multi-channel funnels report are defined as being part of the Multi-Channel Funnels Channel Grouping. The conversion funnel has conversion touchpoints and shows default conversions.
A network report is a Google Analytics report that tracks all the traffic from a particular domain or subdomain. It can also be used to track visitors from an entire website network, such as subdomains if you have access to Google Analytics for the domain.
Campaign reports are a great feature of Google Analytics. They let you see how your campaigns are doing in one place, so you can optimize them for better performance. Campaign reports in Google Analytics are a great way to see the impact of your marketing campaigns. They show you your conversion metrics, sales, and other stats broken down by campaign name.
There are three types of campaign reports that you should check out on a regular basis:
Email Campaign H4 need
This campaign engages the audience and drives site traffic in three simple steps:
Google Ads Campaign
The Google ads campaign helps you organize and schedule campaigns that display your ads or promotions to potential consumers. The most important thing that you need to know about creating a successful Adwords campaign is finding and selecting the right keywords for your business.
Conversions are the activities of users that contribute to your business's success. In GA4 these are called conversions while n Universal Analytics the same activities are known as goals. (Goal Tracking, Goal Completion, Analytics Import Analytics Goals, Google Analytics Goal)
Google Analytics Filters
Custom Filter
To check traffic sources on specific pages:
Google Analytics is one of the most popular web analytics tools on the market. Thousands of companies use Google Analytics to track their online traffic. Here are some best practices and things you should know before diving into Google Analytics. Lots of companies keep their analytics dashboards private, but here’s the thing – it’s really important and useful to share your analytics data with your team. Everyone needs a basic understanding of what’s going on in your analytics.
Google Analytics is a free service that allows website owners to track their visitors' online activity. This information can help them determine how much traffic they are getting from each site, where those people came from, what keywords they used to find your site, etc.
You can easily install this tool on your own website using a simple code snippet. If you already have Google Analytics installed on your site, just copy the code below into your website's HTML file.
Google Analytics provides an overview of how traffic arrived at your website. It includes information about where visitors are coming from (country), what browser they use, their operating system, and whether they have visited before. You can even view this data by day or month. If you require assistance from a Google Analytics expert. Look no further than the Osborne Digital Marketing team. We'd be happy to help.